The Claim
The story goes: Enterprise Edition can use every core for parallel execution, but Standard Edition secretly caps the max degree of parallelism at 4, no matter what you configure. It is a tidy explanation, it sounds like the kind of licensing gotcha Microsoft loves to bury in a footnote, and it gets repeated in forum answers whenever someone on Standard Edition sees a query running slower in parallel than expected.
Here is exactly that comparison, taken straight from the execution plan tooltips: the identical SELECT statement compiling at Degree of Parallelism 8 on a Developer/Enterprise Edition instance, and at Degree of Parallelism 2 on the Standard Edition instance where the real problem was hiding. It looks like an open-and-shut case.
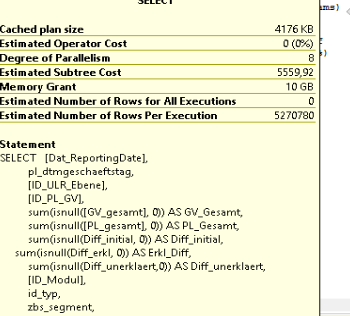
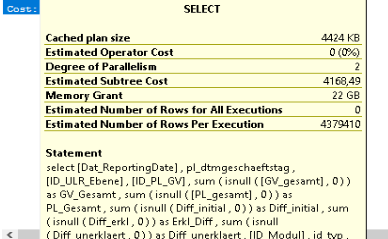
It is also not what sys.configurations or Query Store shows when you actually go and check.
What Standard Edition Actually Limits
Standard Edition does have documented compute capacity limits. From Microsoft's edition comparison, the Database Engine on Standard Edition is capped at the lesser of 4 sockets or 24 cores per instance, and there are lower ceilings on buffer pool memory and columnstore/in-memory OLTP memory compared to Enterprise. Those are real, licensing-enforced limits.
None of that is the same claim as "MAXDOP is capped at 4." The max degree of parallelism server configuration is a plain sp_configure value, and on a Standard Edition instance with 8 logical CPUs it will happily accept, store, and apply a value of 8:
SELECT name, value, value_in_use, minimum, maximum
FROM sys.configurations
WHERE name = 'max degree of parallelism';

-- name                        value  value_in_use  minimum  maximum
-- max degree of parallelism   8      8             0        32767
value_in_use matching value means the setting is live, not silently clamped. If Standard Edition enforced a hard DOP ceiling of 4, this is exactly where it would show up, and it does not.
Putting It to the Test
Theory is cheap; Query Store has a memory. On a Standard Edition instance (8 logical CPUs, max degree of parallelism = 8, cost threshold for parallelism = 50, Resource Governor disabled, no affinity mask set), the same aggregation query had been recompiled and re-executed dozens of times over several weeks. Query Store's runtime stats keep avg_dop, min_dop, and max_dop per plan, so the history is queryable directly:
SELECT
    p.plan_id,
    rs.first_execution_time,
    rs.last_execution_time,
    rs.count_executions,
    rs.avg_dop,
    rs.min_dop,
    rs.max_dop,
    rs.avg_duration / 1000.0 AS AvgDurationMs
FROM sys.query_store_query q
JOIN sys.query_store_plan p ON p.query_id = q.query_id
JOIN sys.query_store_runtime_stats rs ON rs.plan_id = p.plan_id
WHERE q.query_hash = @QueryHash
ORDER BY rs.last_execution_time DESC;
The result on that Standard Edition instance: plan after plan with avg_dop = 8, max_dop = 8, spanning weeks of executions. Not once, not as a fluke; DOP 8 was the routine outcome for that query text on that server, on the edition that is supposedly capped at 4. Whatever was later limiting that same query to DOP 2, it was not the SKU on the box.
Ruling Out "It's Just a Stuck Plan"
The obvious next theory when a query keeps running at a lower DOP than expected is a single unlucky cached plan: it compiled once under memory or scheduler pressure, cached at DOP 2, and has been reused ever since. That is a real and common failure mode, and it is easy to check by pulling the actual DOP baked into the cached plan XML:
;WITH XMLNAMESPACES (DEFAULT 'http://schemas.microsoft.com/sqlserver/2004/07/showplan')
SELECT
    qs.plan_handle,
    qs.creation_time,
    qs.execution_count,
    CachedPlanDOP = qp.query_plan.value('(//QueryPlan/@DegreeOfParallelism)[1]', 'int')
FROM sys.dm_exec_query_stats qs
CROSS APPLY sys.dm_exec_query_plan(qs.plan_handle) qp
WHERE qs.query_hash = @QueryHash
ORDER BY qs.creation_time;
If there is exactly one plan handle sitting at DOP 2 since some point in the past, "stuck plan" is a live hypothesis: evict it with a targeted DBCC FREEPROCCACHE(@PlanHandle) (never the whole cache) and let it recompile.
But that is not what the evidence showed here either. Multiple, distinct plan IDs, compiled on different days, all landed on DOP 2 for the current query text, while the DOP 8 plans belonged to an earlier version of the same query (the view behind it had since been edited). A single stuck plan cannot explain a pattern that survives multiple fresh compiles. The optimizer was choosing DOP 2 again and again, on its own, for the query as it exists now.
The Real Culprit: A CPU Topology the Hypervisor Never Actually Had
With the edition ruled out and the plan cache ruled out, the answer was sitting in a column that is easy to skim past in a wall of DMV output: hyperthread_ratio in sys.dm_os_sys_info.
SELECT cpu_count, hyperthread_ratio, scheduler_count,
       socket_count = cpu_count / NULLIF(hyperthread_ratio, 0)
FROM sys.dm_os_sys_info;

-- cpu_count  hyperthread_ratio  scheduler_count  socket_count
-- 8          8                  8                1
A hyperthread_ratio of 8 with cpu_count of 8 tells the engine it is looking at one physical core carrying eight hardware threads, not eight independent cores. On real hardware that ratio would mean severe SMT oversubscription. On this VM it was an artifact of how the guest's virtual CPU topology had been defined at the hypervisor: all eight vCPUs assigned as threads under a single virtual core instead of as eight independent virtual cores. VMware will build exactly that layout if the "Cores per Socket" setting is left at a value that bundles every vCPU into one core rather than spreading them across sockets or cores, and Windows and SQL Server take the reported topology at face value.
A quicker sanity check on the same DMV: divide logical CPUs by the hyperthread ratio directly to see how many physical cores SQL Server believes it is running on.
SELECT cpu_count AS [Logical_CPUs],
       hyperthread_ratio AS [Hyperthread_Ratio],
       cpu_count / hyperthread_ratio AS [Physical_Cores]
FROM sys.dm_os_sys_info;
One physical core for eight logical CPUs is the number that gave the game away here.
SQL Server's scheduler and query-execution code treats that reported ratio as a real hardware constraint. Packing eight parallel workers onto what the engine believes is a single physical core is precisely the thread-contention scenario its own admission logic exists to avoid, so it settled toward a conservative degree of parallelism for the expensive queries instead of trusting the configured max degree of parallelism of 8. No license check was involved anywhere in that decision. The engine was reacting, correctly, to a CPU topology description that did not match the physical reality underneath the VM.
The Fix: Tell the Hypervisor to Report Real Cores
The fix lives entirely in the VM's CPU configuration, not in SQL Server, and it has to be applied while the VM is powered off:
- Set Virtual Sockets to 1 (or 2) and Cores per Socket to 8 (or 4, if using 2 sockets), so all 8 vCPUs are presented as independent cores rather than as threads stacked on a single core.
- Power the VM back on. SQL Server reads CPU topology once at startup and does not re-evaluate it while running, so a configuration change without a restart accomplishes nothing.
- Re-run the
sys.dm_os_sys_infoquery above.hyperthread_ratioshould now read 1.
After that restart, the same queries that had been compiling at DOP 2 for weeks compiled at DOP 8 again, using the exact max degree of parallelism setting that had been configured the entire time. Nothing on the SQL Server side changed. Only what the hypervisor told the guest about its own CPUs did.
What Actually Decides DOP, Beyond This Case
Not every low-DOP mystery is a VM topology problem, but the mechanism generalizes: what decides parallelism on any edition is the optimizer's cost-based choice at compile time, and the runtime and hardware conditions it compiled under. In practice that means checking, in this order:
- Reported CPU topology. On a VM, check
hyperthread_ratioandsocket_countinsys.dm_os_sys_infobefore anything else. A ratio that implies real hardware threads packed onto few physical cores will make the engine deliberately conservative about parallelism, independent of MAXDOP, edition, or workload. - Cost threshold vs. estimated cost. Below
cost threshold for parallelism, the plan is serial regardless of MAXDOP. Above it, the optimizer still picks a DOP it judges economical, not automatically the maximum available. - Cardinality estimates. A view built from unioned branches with correlated subqueries and stale statistics can easily mis-estimate row counts badly enough to change the parallelism decision between one compile and the next.
- Memory grant pressure at compile time.
sys.dm_exec_query_resource_semaphoresand current grants insys.dm_exec_query_memory_grantsshow whether the optimizer was compiling under a tight memory budget, which can push it toward a lower DOP to keep the per-thread grant affordable. - Scheduler contention at compile time.
sys.dm_os_schedulersand concurrently runningdop > 1requests insys.dm_exec_requestsshow whether other parallel work was already saturating the visible schedulers.
A Compact Diagnostic Script
Combine the checks above into one read-only pass. Nothing here scans user tables; it is all metadata and DMVs, safe to run on a production instance:
SET NOCOUNT ON;

-- Edition and DOP-relevant configuration
SELECT
    ServerName    = @@SERVERNAME,
    Edition       = SERVERPROPERTY('Edition'),
    EngineEdition = SERVERPROPERTY('EngineEdition');  -- 2=Standard, 3=Enterprise/Developer

SELECT name, value, value_in_use
FROM sys.configurations
WHERE name IN ('max degree of parallelism', 'cost threshold for parallelism',
               'affinity mask', 'affinity64 mask');

-- CPU topology as SQL Server actually sees it (check this first on any VM)
SELECT cpu_count, hyperthread_ratio, scheduler_count,
       socket_count = cpu_count / NULLIF(hyperthread_ratio, 0)
FROM sys.dm_os_sys_info;
-- hyperthread_ratio > 1 on a VM usually means the hypervisor is presenting
-- vCPUs as hardware threads on fewer cores than were actually assigned

-- Visible schedulers vs. logical CPUs (affinity mask can silently shrink this)
SELECT COUNT(*) AS OnlineSchedulers, COUNT(DISTINCT parent_node_id) AS NumaNodes
FROM sys.dm_os_schedulers
WHERE status = 'VISIBLE ONLINE';

-- Resource Governor: confirm it is not quietly capping DOP per workload group
SELECT is_enabled FROM sys.resource_governor_configuration;
SELECT name, max_dop FROM sys.resource_governor_workload_groups;

-- DOP history for the query in question, if Query Store is on
SELECT
    p.plan_id, rs.first_execution_time, rs.last_execution_time,
    rs.count_executions, rs.avg_dop, rs.min_dop, rs.max_dop
FROM sys.query_store_query q
JOIN sys.query_store_plan p ON p.query_id = q.query_id
JOIN sys.query_store_runtime_stats rs ON rs.plan_id = p.plan_id
WHERE q.query_hash = @QueryHash
ORDER BY rs.last_execution_time DESC;

-- Parallelism-related waits: is the server actually starved for schedulers/memory?
SELECT wait_type, waiting_tasks_count, wait_time_ms, signal_wait_time_ms
FROM sys.dm_os_wait_stats
WHERE wait_type IN ('THREADPOOL', 'RESOURCE_SEMAPHORE',
                     'RESOURCE_SEMAPHORE_QUERY_COMPILE', 'CXPACKET', 'CXCONSUMER')
ORDER BY wait_time_ms DESC;
The Verdict
Standard Edition does not enforce a hidden MAXDOP ceiling. If value_in_use for "max degree of parallelism" shows the value you set, the engine is applying it. A lower observed DOP is a compile-time decision, and on a VM the first thing driving that decision may be a CPU topology the hypervisor never actually built, not cost, cardinality, memory, or the license.
Blaming the SKU is the fastest way to stop looking in the right place. Before you write off a parallelism problem as a licensing limit, check value_in_use, then check hyperthread_ratio if you are virtualized, pull the Query Store DOP history for the query, and rule out a stuck plan by comparing DOP across several distinct plan IDs. In this case the entire fix was a "Cores per Socket" setting and a VM restart. Edition was never actually in play.