powershelldba.de
REF: PSDB-SRA-2026 SCOPE: SQL Server 2016+ / T-SQL STATUS: v1.0
Module

Find the queries that hurt — and get told exactly why.

SQL Refactor Analyzer is a Windows desktop tool that scans stored procedures, views, and functions — across a live database or a folder of .sql files — for anti-patterns and deprecated syntax, then correlates that with real execution-plan and index data from the DMVs. It draws the execution plan as a colour-coded operator tree, ranks your worst objects into a dedicated Problem-Queries view, and generates ready-to-use fixes. It is strictly read-only: it only ever runs SELECT against system catalog views, never ALTER/CREATE/DROP, and never writes back to a scanned file.

Why this exists

"The database is slow" is not a work item.

Turning a vague complaint into a prioritised list of concrete changes usually means hand-writing DMV queries, reading plan XML by eye, and knowing which anti-patterns to grep for. This tool does all three at once and hands you the shortlist.

Without itWith SQL Refactor Analyzer
Anti-patterns found only when someone happens to read the codeEvery module scanned against 14 rules in one pass
Plan XML read by eye, warning by warningA colour-coded operator tree with the decisive problems highlighted
"Missing index" hints copied out of SSMS one at a timeGenerated CREATE INDEX statements, ranked by impact
No sense of which object is actually the worstA Problem-Queries view ranking objects by severity & impact
No way to prove last month's cleanup actually helpedBaseline compare: new / fixed / unchanged since a saved scan
Requirements

What it needs.

Operating systemWindows 10, Windows 11, or Windows Server 2019 or later
Runtime.NET Framework 4.8 — ships with Windows, nothing to install on a target DBA workstation or jump host
SQL Server2016 or later for the live-database and Query Store features; the static .sql folder scan needs no SQL Server at all
AccessA login that can read the DMVs and catalog views — no elevated rights, no writes
DependencyMicrosoft.Data.SqlClient — used only for live-database connections

This is a standalone Windows desktop application, not a PowerShell module — it doesn't need dbatools or PowerShell to run. It's a native rewrite of the earlier PowerShell sqmRefactorTool wizard, built by the same author as the rest of this toolchain.
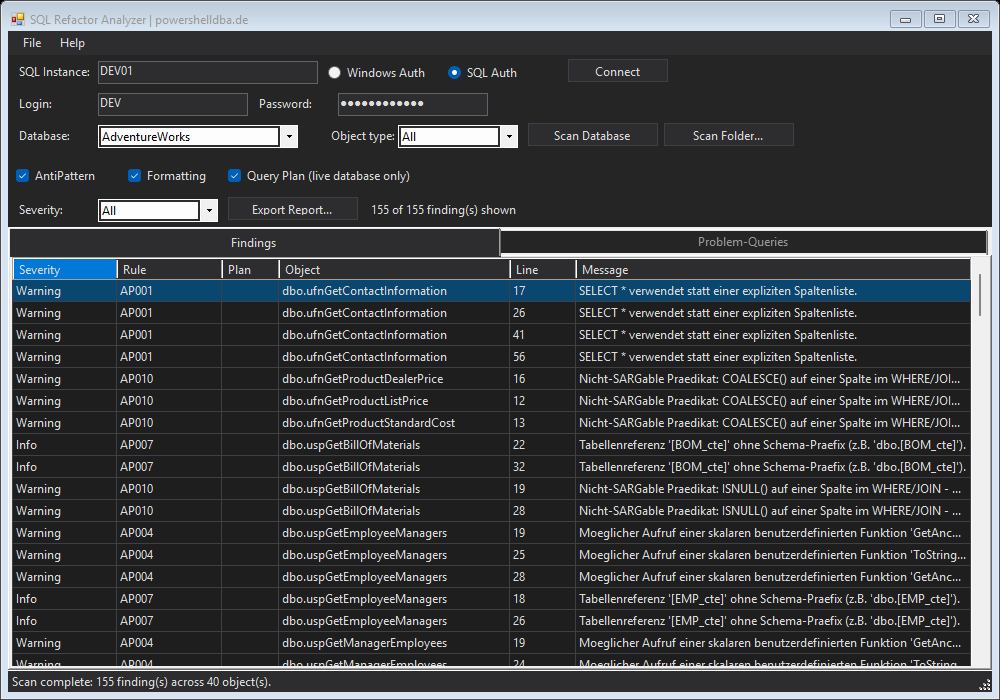
SQL Refactor Analyzer main window connected to the AdventureWorks sample database: the Findings grid lists warnings by rule — SELECT * (AP001), non-SARGable predicates (AP010), scalar UDF in predicate (AP004), missing schema prefix (AP007) — across sample stored procedures and functions, with a Plan column, a severity filter, and a Problem-Queries tab, showing 155 findings across 40 objects
The single-window dashboard: connect, pick a database, scan. Here against Microsoft's AdventureWorks sample database — 155 findings across 40 objects, each tied to a rule and an object.
Static scan

Sixteen rules, run against every module.

Each rule scans the T-SQL token stream — a dependency-free tokenizer, not a full parser — for a specific, well-understood problem. Anti-patterns (AP) and formatting rules (FMT) run offline on a folder of .sql files as happily as they do against a live database.

RuleSeverityWhat it flags
AP001WarningSELECT * instead of an explicit column list
AP002WarningWITH (NOLOCK) table hint
AP003WarningCursor instead of set-based processing
AP004WarningLikely scalar UDF call in a WHERE/JOIN predicate
AP005CriticalDynamic SQL built via string concatenation in EXEC()
AP006InfoUser procedure named with the reserved sp_ prefix
AP007InfoTable reference without an explicit schema prefix
AP008CriticalDeprecated *=/=* outer-join syntax
AP009CriticalUPDATE/DELETE without a WHERE clause
AP010WarningFunction on a column in a predicate (YEAR(col) = ...) — non-SARGable
AP011WarningNOT IN with a subquery — one NULL silently empties the result
AP012WarningSELECT TOP n without ORDER BY — nondeterministic
AP013WarningLeading-wildcard LIKE '%...' — non-SARGable, forces a scan
AP014WarningArithmetic or concatenation on a column in a predicate (Col + 1 = ...) — non-SARGable
FMT001InfoMissing SET NOCOUNT ON
FMT002InfoInconsistent keyword casing

Findings export to a self-contained dark-theme HTML report or to Markdown, both led by a prioritised "Action Items" list — the highest-severity, highest-impact findings across every rule, first.

Execution-plan analysis

What the optimizer is actually doing, in plain language.

Against a live database, the tool reads cached plans and index DMVs and turns them into findings — no plan XML to decode by hand.

CheckWhat it surfaces
QP001Plan-cache warnings with a plain-language root cause — spills to tempdb, implicit conversions, missing statistics, cross joins with no predicate
QP002–004Unused, duplicate/overlapping, and disabled indexes
QP005Plan overview: degree of parallelism vs. the server's real cost threshold for parallelism, and memory-grant efficiency
QP006The most expensive operators per statement, by estimated subtree cost
QP007Cardinality mismatch: estimated vs. actual average row count, sorted by severity, with likely root causes
QP008DBA heuristics: skewed hash/merge-join inputs and per-thread parallelism skew
QP009Missing-index suggestions with a generated, ready-to-use CREATE INDEX statement

These rely on the plan cache and DMVs, so they reflect what has actually run recently — read-only, and honest about their limits: a cached plan holds compile-time estimates, and where a value only exists in an actual plan the tool says so rather than guessing.

Plan visualizer

The operator tree, with the real problems in red.

Double-click any query-plan finding to open the execution plan as a graphical operator tree. Box colour is a cost heat map; edge thickness scales with estimated row count — the same "fat pipe" idea SSMS uses. But cost only tells you what's expensive, not what's broken, so decisive problems get their own fixed highlight: an operator with a critical plan warning (a tempdb spill, a cross join with no predicate) is drawn solid red no matter how cheap it looks, and lesser warnings get an amber border. A cheap-but-broken operator can't hide next to an expensive-but-fine one.

RedCritical plan problem — spill to tempdb, cross join without predicate
AmberWarning — implicit convert, missing stats, skewed join input
SelectedClick an operator for its full cost / rows / IO / CPU breakdown

When a plan has been evicted from the cache, the visualizer falls back to Query Store automatically — so plans survive restarts and eviction — and the window title tells you which source it used. You can save any statement's plan as a .sqlplan file for full-detail viewing in SSMS or Azure Data Studio, and open a .sqlplan a colleague sends you completely offline.

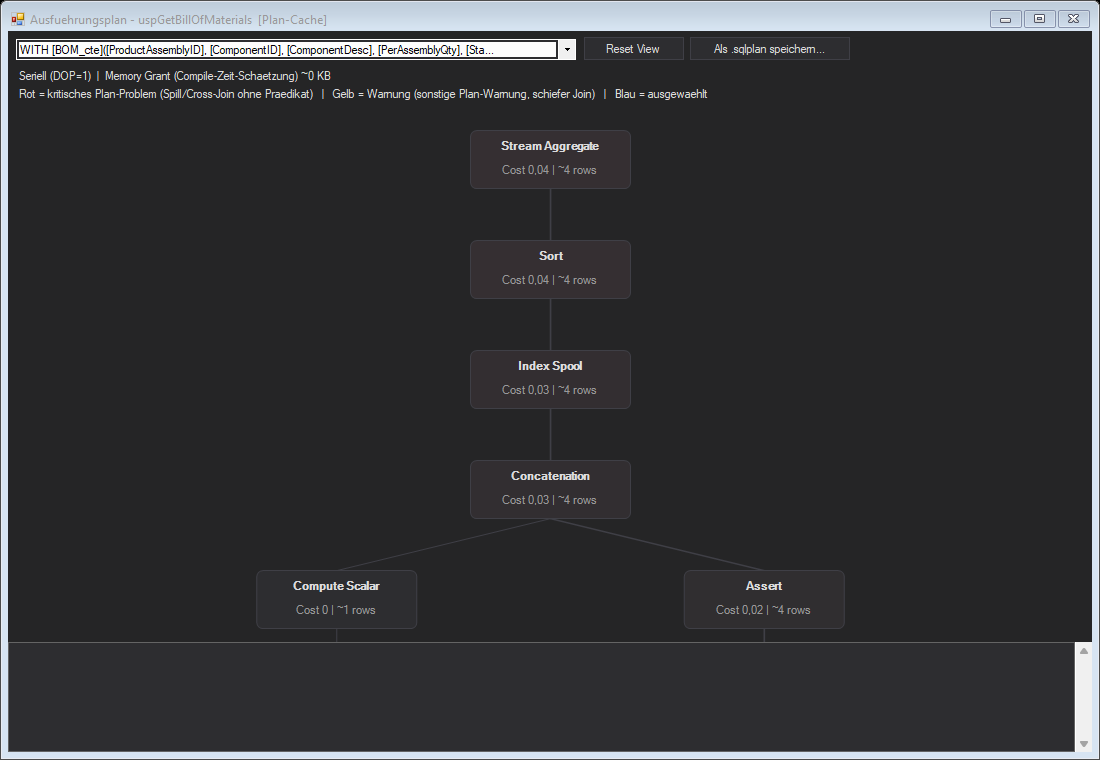
The plan visualizer showing the execution plan for the AdventureWorks uspGetBillOfMaterials stored procedure sourced from the plan cache: a top-down operator tree with Stream Aggregate at the root, then Sort, Index Spool, and a Concatenation splitting into a Compute Scalar and an Assert, each box labelled with its estimated subtree cost and row count, above a legend explaining the red/amber/blue colour coding
The plan visualizer on a recursive AdventureWorks procedure. Root operator at the top, children fanning out below, each box showing cost and estimated rows — with a "Save as .sqlplan" button for full-detail viewing elsewhere.
Problem queries

Which object should you fix first?

A flat findings list doesn't tell you where to start. The Problem-Queries tab groups every finding by object and ranks them by a severity- and impact-weighted score — an object racking up a SELECT *, a cursor, a cardinality mismatch, and a missing index is empirically a worse query than one with a single formatting nit, and this surfaces that automatically. Select a row to see every finding for that object, plus any ready-to-use improvement suggestion (like QP009's generated CREATE INDEX). It's a different lens on the same scan, not a second engine.

Baseline compare

Prove the cleanup actually landed.

Save the current findings as a JSON baseline, then compare a later scan against it: new, fixed, and unchanged since the baseline. For recurring engagements on the same database, that turns the report from a snapshot into a progress record. The comparison ignores the volatile numbers embedded in plan messages, so it doesn't report the same problem as both fixed and new every run. Available in the GUI and headless for CI.

Automation

Scriptable for build pipelines and CI/CD.

The same engine that drives the GUI is available from the command line — for gating a build on new anti-patterns, or generating a report as a pipeline artifact.

SqlRefactorAnalyzer.exe --scanfolder <folder> [--savebaseline <file.json>]   # Scan *.sql, optionally save a baseline
SqlRefactorAnalyzer.exe --scanfolder <folder> --comparebaseline <file.json>   # Diff against an earlier baseline
SqlRefactorAnalyzer.exe --report <folder> html|md <outfile>              # Scan + write a report
SqlRefactorAnalyzer.exe --dbscan <server> <database> [--plananalysis]     # Live scan incl. plan/index analysis
Technical details

Why it's built this way.

Read-only by design

Every database interaction is a SELECT against a catalog view or DMV. The tool never issues DDL or DML, never modifies a scanned .sql file, and never stores a password — SQL-authenticated connections re-enter the password each session.

.NET Framework 4.8, on purpose

Target machines are DBA workstations and jump hosts that don't reliably have a modern .NET desktop runtime. .NET Framework 4.8 ships with Windows, so deployment is a folder copy — no installer, no runtime prerequisite. A GitHub Actions workflow packages the ready-to-run build as a ZIP on every release tag.

Token stream, not a full parser

Rules scan a flat token stream rather than a full T-SQL parse tree — a documented trade-off shared with the rest of this toolchain. It keeps the tool dependency-free and fast; the edge cases where a token scan can mis-bound a clause are documented per rule, not swept under the rug.

Next steps

Scan a folder today, point it at a database next.

The offline folder scan needs nothing but the executable; the plan analysis and visualizer add value the moment you connect to a live instance.